Majority of Canadian provinces face minimal exposure to U.S. viral hotspots
Canada’s pandemic situation improved this summer, as provinces entered Phase 3 of their economic reopening and viral caseloads were more or less contained. Things have become more worrisome of late, as case counts picked up in many provinces. Nevertheless, our largest trading partner still exhibits significantly higher active caseloads proportionally. If the COVID-19 situation were to deteriorate in the U.S., this could pose a risk to provincial economic recovery. Fortunately, most Canadian provinces face limited exposure to current U.S. viral hotspots and viral caseloads are largely under control in our main state trading partners. But the degree of that exposure varies among provinces, with Alberta, Nova Scotia, British Columbia and Manitoba the most vulnerable.
Key points:
- The U.S. has struggled to control the spread of COVID-19 in a number of U.S. states, including Louisiana, Florida, Georgia, and Arizona.
- Alberta, Nova Scotia, British Columbia, and Manitoba’s trade with the U.S. is more exposed to these states.
- A wrong turn in current U.S. COVID-19 hotspots could dim provincial outlooks, but only slightly, since exposure to these states is relatively low
- Industrial-resource trade is at greater risk than natural-resource trade, since the former is more exposed to international demand conditions.
- Could higher U.S. COVID-19 case volumes pose a threat to provincial trade?
An easing of restrictions in many U.S. states in May was followed by a worrying resurgence of the virus. In a number of states, the outbreaks were far more severe than those that took place in April. Since daily new active cases peaked in July, the outlook has improved, with the number of new U.S. cases declining through August. Nevertheless, as the re-opening process continues, rising U.S. case counts could pose a risk to provincial economies. COVID-related risks to trade are mainly two-fold: supply chain disruptions caused by government ordered shutdowns of businesses due to increased viral presence, and declines in external demand for Canadian goods/commodities (which is reflected in falling global prices for certain commodities). A third risk is protectionism- an already rising trend exacerbated by COVID-19. This paper focuses on exposure to the U.S., our top trading partner and a country where the challenges of controlling the pandemic have been severe.
Viral trade exposure reflects proximity to U.S. “hotspots”
Trade exposure to U.S. viral hotspots varies by province. Here, we have looked at total trade (imports and exports) within the goods-producing sector to capture both demand and supply-side risks—and have ranked the provinces according to their degree of exposure to these risks.1 The majority of Canadian provinces have limited exposure to current hotspots. Indeed, all but three Canadian provinces are exposed via trade to states where new daily cases are below the U.S. average of 45 per day/1,000,000 population.
In general, Atlantic provinces (with the exception of Nova Scotia) had lower levels of trade exposure to U.S. hotspots. Newfoundland and New Brunswick are the least exposed among the provinces since the majority of their trade is conducted with U.S. states posting relatively low viral case counts.
At the other end of the rankings, Alberta, Nova Scotia, and British Columbia are the most exposed to U.S. COVID hotspots. In British Columbia, the majority of U.S. imports and exports come from states with active viral caseloads above the median. And Nova Scotia, as an import-based economy, derives most of its U.S. imports from states that are also experiencing relatively higher viral case counts. However, it is important to note that less than 30% of Nova Scotia’s trade is with the U.S.. Indeed, as a coastal province, it trades with a diverse range of countries. For instance, a large portion of its trade is conducted with Asia, a region that has managed to contain viral transmission comparatively well. BC also conducts relatively less trade with the U.S. than interior provinces, despite facing greater exposure to states with higher active viral caseloads. Lastly, Alberta has the highest level of relative exposure, with 83% of exports destined for the U.S., one-third of which are destined for Illinois (which has the fifth-highest viral caseload in the U.S. based on population).
It’s important to note that since Alberta’s economy is largely based on natural-resources trade, the specific economic performance of its main trade partner is less important. The same can be said for Saskatchewan and Newfoundland. Alberta mainly exports crude oil, and typically, the first or final destination of this commodity matters less than its international market price—and ensuring there is sufficient transportation infrastructure in place move it. At the moment, with North American oil production slowing significantly, Alberta’s main concern is the deterioration of global oil demand, rather than transportation challenges or the potential shuttering of U.S. refineries. Indeed, if mounting COVID-19 cases in the United States were to result in a second shutdown, the biggest risk to Alberta would be posed by deteriorating demand conditions and energy prices. The same could be said of a province like Quebec, which exports predominantly aerospace products and parts.
Conclusion
The year 2020 has been marred by provincial trade disruptions. After grappling with rail blockades—which disrupted movement in B.C., Ontario, and Quebec—provinces confronted unprecedented trade challenges due to COVID-19. Western Canadian hog farmers faced lower demand for feeder hogs due to American plant closures, PEI potato producers had lost crucial buyers for their product when restaurants closed, and crude volumes transported to the U.S. fell significantly. We are projecting widespread provincial declines in real GDP from –3.8% y/y in Manitoba to –10.9% in Newfoundland and Labrador. Nationally, growth is expected to fall 6.0% in 2020. With provincial economies re-opening, the recovery is well underway, but if a second wave in the U.S. leads to spillover effects in trade activity, this could dampen the provincial outlook further.
And while our index adequately captures risk for current U.S. hotspots, it is important to emphasize that hotspots could shift in the coming months as the viral situation evolves.

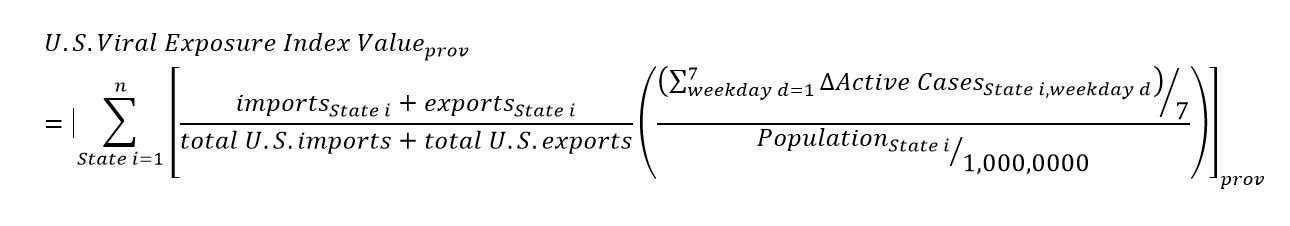
‡ Methodology
RBC’s trade exposure index utilizes daily U.S. novel coronavirus (COVID-19) data from Johns Hopkins University. We constructed the index with the goal of ranking each province’s relative trade exposure to U.S. COVID-19 “hotspots.” To calculate viral risk for each state, we determine each state’s active caseload per population of 1,000,000 (population by state is based on 2019 U.S. Census data). Next, we measure provincial trade exposure for each province to a given state by calculating the province’s imports and exports to that state as a share of the province’s total imports and exports to the U.S. We consider each state in the continental U.S. and Hawaii, excluding unspecified states and overseas U.S. territories. Viral exposure by state is calculated by multiplying viral risk for a given state by provincial trade exposure to that state. To derive the index value for each province, we sum viral exposure to all continental U.S. states and Hawaii for that province. The following expression is a representation of our calculation for each province, for a given state i for a province that trades with n total U.S. states.
Carrie Freestone is an economist at RBC. She holds a Bachelor of Arts (honours) in Economics from Queen’s University and a Master of Arts in Economics from the University of Ottawa.
This article is intended as general information only and is not to be relied upon as constituting legal, financial or other professional advice. A professional advisor should be consulted regarding your specific situation. Information presented is believed to be factual and up-to-date but we do not guarantee its accuracy and it should not be regarded as a complete analysis of the subjects discussed. All expressions of opinion reflect the judgment of the authors as of the date of publication and are subject to change. No endorsement of any third parties or their advice, opinions, information, products or services is expressly given or implied by Royal Bank of Canada or any of its affiliates.